Kari Flottorp Lingsom, Nicolay Woldsdal og Håkon Østmoe Brandsnes ble valgt ut blant flere hundre søkere, mens Ulrica Risberg kjenner byrået fra kundesiden.
Author: mscrew
Fire nye rådgivere til Apeland
Kari Flottorp Lingsom, Nicolay Woldsdal og Håkon Østmoe Brandsnes ble valgt ut blant flere hundre søkere, mens Ulrica Risberg kjenner byrået fra kundesiden.
Smeh og Morgenstern deler på månedens jobb for september
– Tøft gjort av Oda å ta tak i dette, sier juryen om Smehs jobb. – Noe av det beste jeg har sett på TV på flere år, blir det sagt om Morgensterns jobb.
Fra i dag åpner Lovdata for fri bruk av lover og forskrifter i KI-verktøy
Nå kan alle bruke gjeldende lover og forskrifter fra Lovdata i sin egen KI-løsning. – Bare fantasien setter grenser for bruken, sier direktør Odd Storm-Paulsen. Advokat Eivind Arntsen mener dette er «årets bombe for juss og kunstig intelligens».
Soleklart flest John Deere i oktober
Omsider har det løsnet for John Deere. De registrerte dobbelt så mange traktorer som andreplassen, men har fortsatt langt færre markedsandeler enn fjoråret.
Capsol leier ut karbonfangstanlegg

Capsol leier ut karbonfangstanlegg Sementprodusent skal teste løsningen det neste halvåret. redaksjonen Få tilgang med AB Pluss Vårt eksklusive innhold er tilgjengelig for abonnenter. Med AB Pluss får du tilgang til Cnytt.no, Avfallsbransjen.no, Hydrogen24.no og Biogassbransjen.no. Dette er innhold du ikke finner andre steder: Oppdaterte bransjenyheter, eksklusivt dybdeinnhold og en omfattende informasjonsbank. Vi tilbyr bedriftsmedlemsskap […]
Innlegget Capsol leier ut karbonfangstanlegg dukket først opp på Cnytt.no.
– Skap etterspørsel etter grønne produkter

– Skap etterspørsel etter grønne produkter Det hjelper ikke med flere støtteprogrammer for produksjon. Nå må etterspørselen stimuleres, krever europeisk industri. jens egil heftøy Få tilgang med AB Pluss Vårt eksklusive innhold er tilgjengelig for abonnenter. Med AB Pluss får du tilgang til Cnytt.no, Avfallsbransjen.no, Hydrogen24.no og Biogassbransjen.no. Dette er innhold du ikke finner andre […]
Innlegget – Skap etterspørsel etter grønne produkter dukket først opp på Cnytt.no.
Lovdata åpner gratis tilgang til norske lover for alle
Kan brukes til å bygge KI-tjenester og chatboter.
Sweden leads in R&D investments for the ninth consecutive year
New preliminary figures show increased research and development (R&D) investments in 2023 compared to 2022 as a percentage of gross domestic product (GDP) across all Nordic countries, except for the Faroe Islands.
Kristina Arge Simonsen, Statistics Faroe Island and Kaja Wendt, Statistics Norway
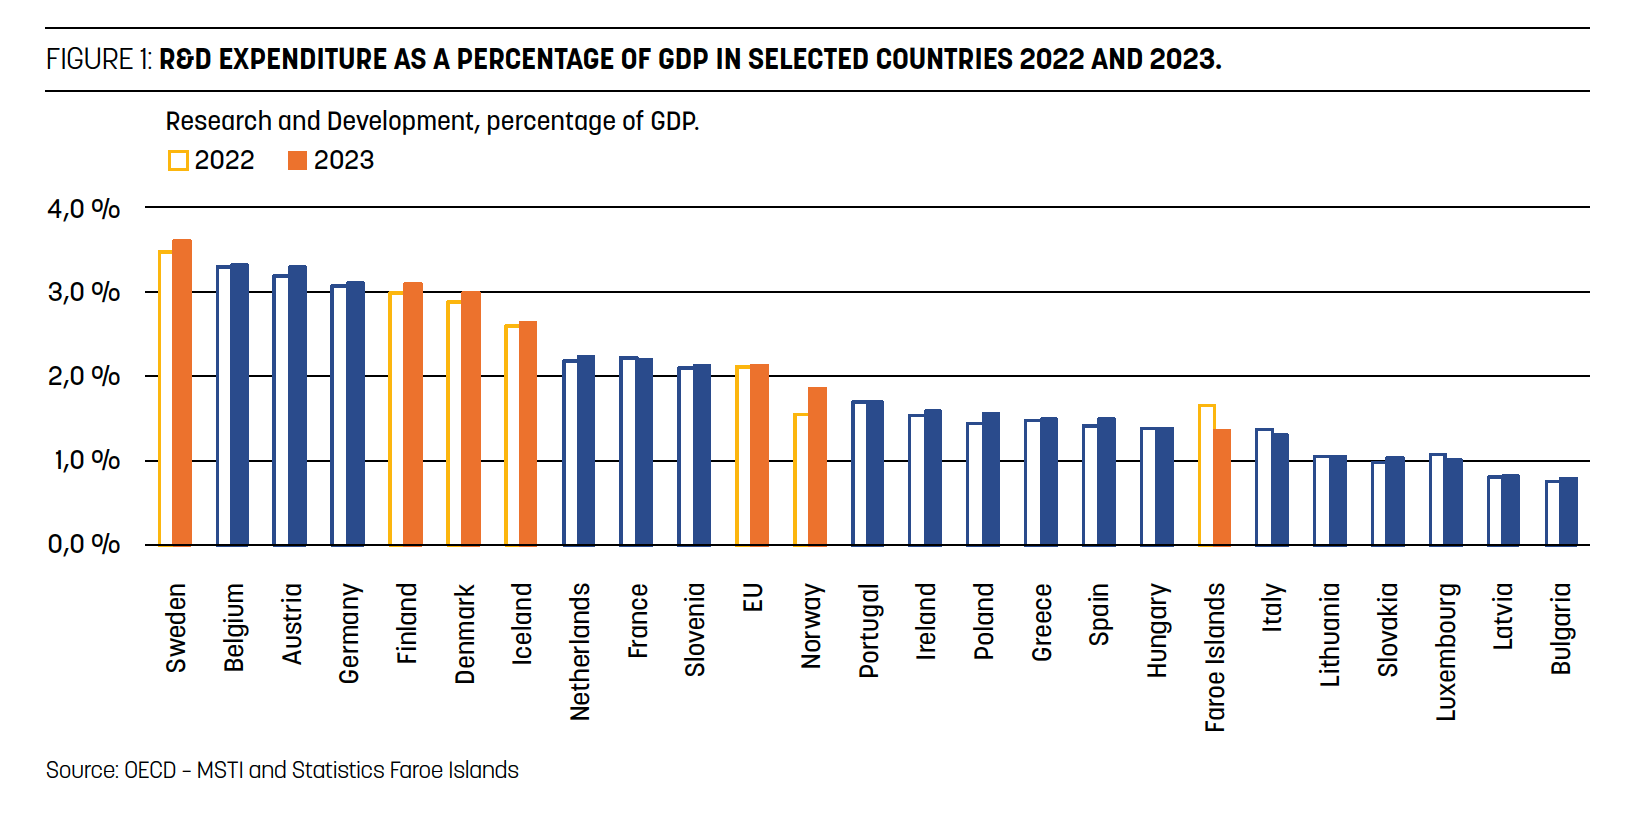
Sweden has maintained the highest investments in R&D as a percentage of GDP among the countries in figure 1 for the 9th year running.
Alongside Sweden, the R&D expenditure in Belgium, Austria, Germany, Finland, and Denmark have also met and exceeded the European Council´s goal of investing 3 percent of the national GDP in R&D. In 2022, only Sweden, Belgium, Austria and Germany had surpassed this threshold.
The first record of Sweden investing more than 3 percent of their GDP in R&D was in 1995, seven years before EU adopted the 3 percent target, which was set in 2002 in Barcelona. In 2019, Finland set a national goal to reach 4 percent of GDP invested in R&D by 2030.
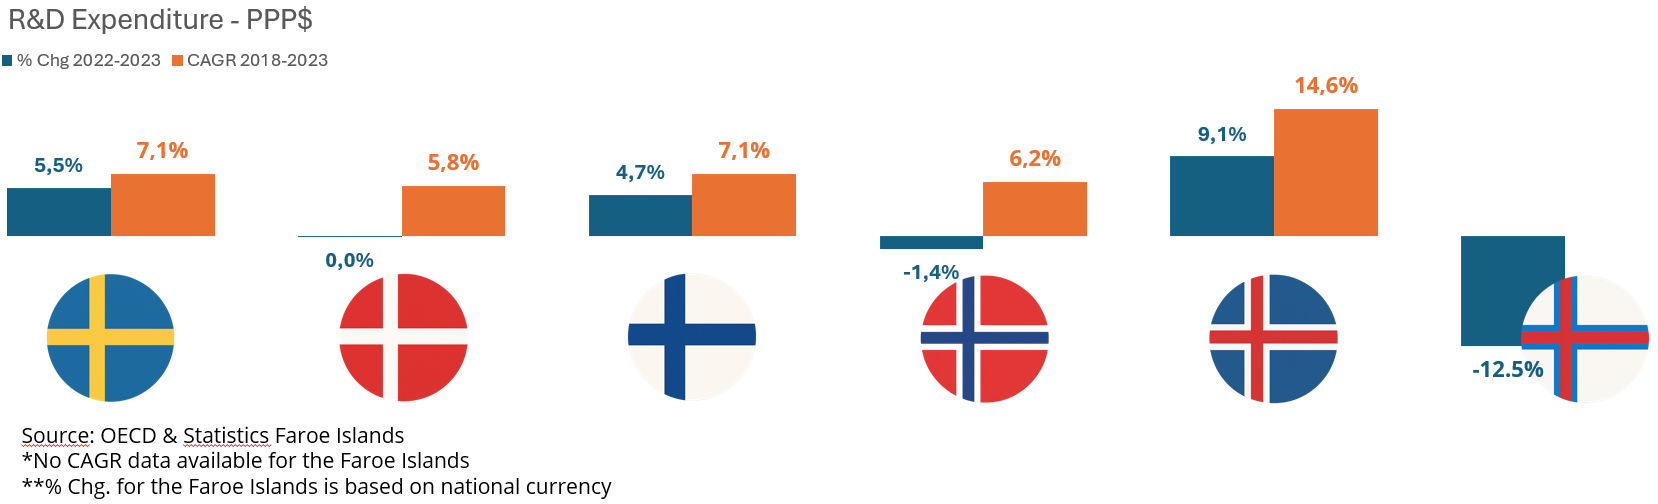
Iceland leads growth in R&D expenditure
Figure 2 Growth rates in GDP & R&D among Nordic countries. PPP$ current prices. 2022–2023.
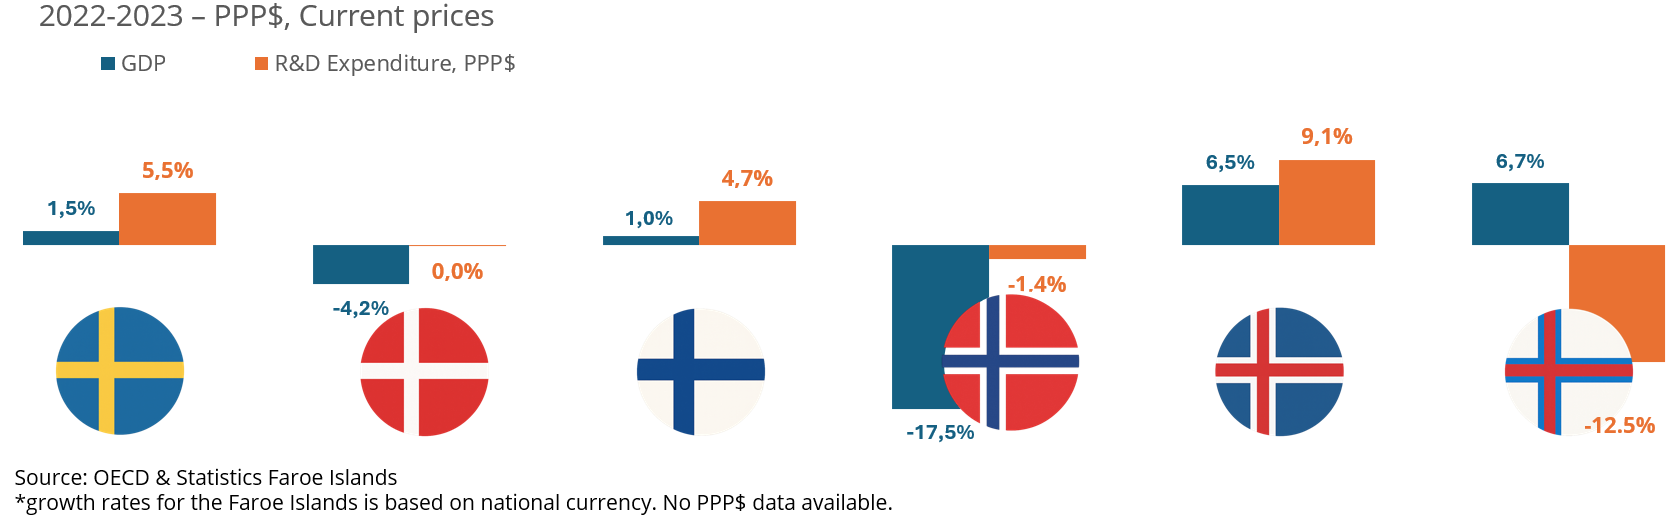
Iceland had the highest growth in R&D investments year over year in 2023, with an increase of 9.1 percent. In 2021 & 2022 its investments in R&D grew into the double digits. However,
Iceland’s growth rates in R&D have a more fluctuating pattern compared to Sweden, Denmark, Finland and Norway, likely due to its smaller population and smaller R&D community.
PPP$
Purchasing power parities (PPP) are currency conversion rates that aim to equalise the purchasing power of different currencies by eliminating price levels differences between countries. Here OECD is the data source, and PPP is linked to the US dollar.
In 2023 the Danish and Norwegian national GDP shrunk by -4.2 percent and -17.5 percent respectively. In Denmark, the expenditure growth in R&D stagnated year over year while Norway saw a decline of -1.4 percent year over year.
The Faroe Islands’ GDP had the highest growth at 6.7 percent, yet saw the largest drop in R&D investments.This change is mainly caused by the business enterprise sector, with its decline of more than 20 percent. As with Iceland, fluctuations in R&D investments in the Faroe Islands are expected due to its size of the population and the R&D community.
The GDP and R&D expenditure growth rates in Sweden and Finland follow similar trends, with R&D investments outpacing GDP growth rates.
Large fluctuations in Norwegian GDP trendline
Figures 3 and 4 show the trendline in GDP and R&D investments for the Nordic countries.
Norway’s GDP trendline shows significant fluctuations, with a notable drop for 2023. According to Statistics Norway the weak economic development for 2023 was due to increased prices, higher interest rates, reduced household demand, and falling prices for oil and gas.
Figure 3 Trendlines – GDP in Nordic countries. PPP$ current prices. 2014–2023.
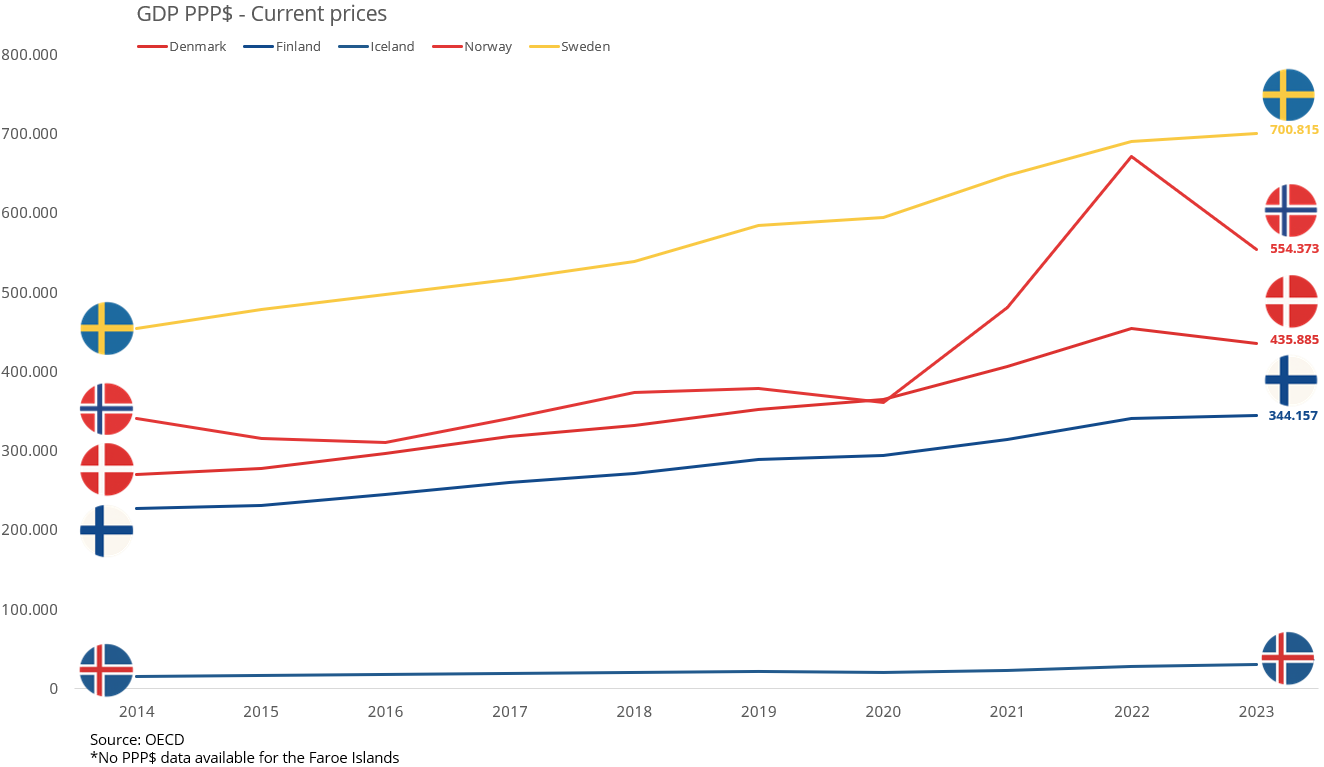
Source: OECD
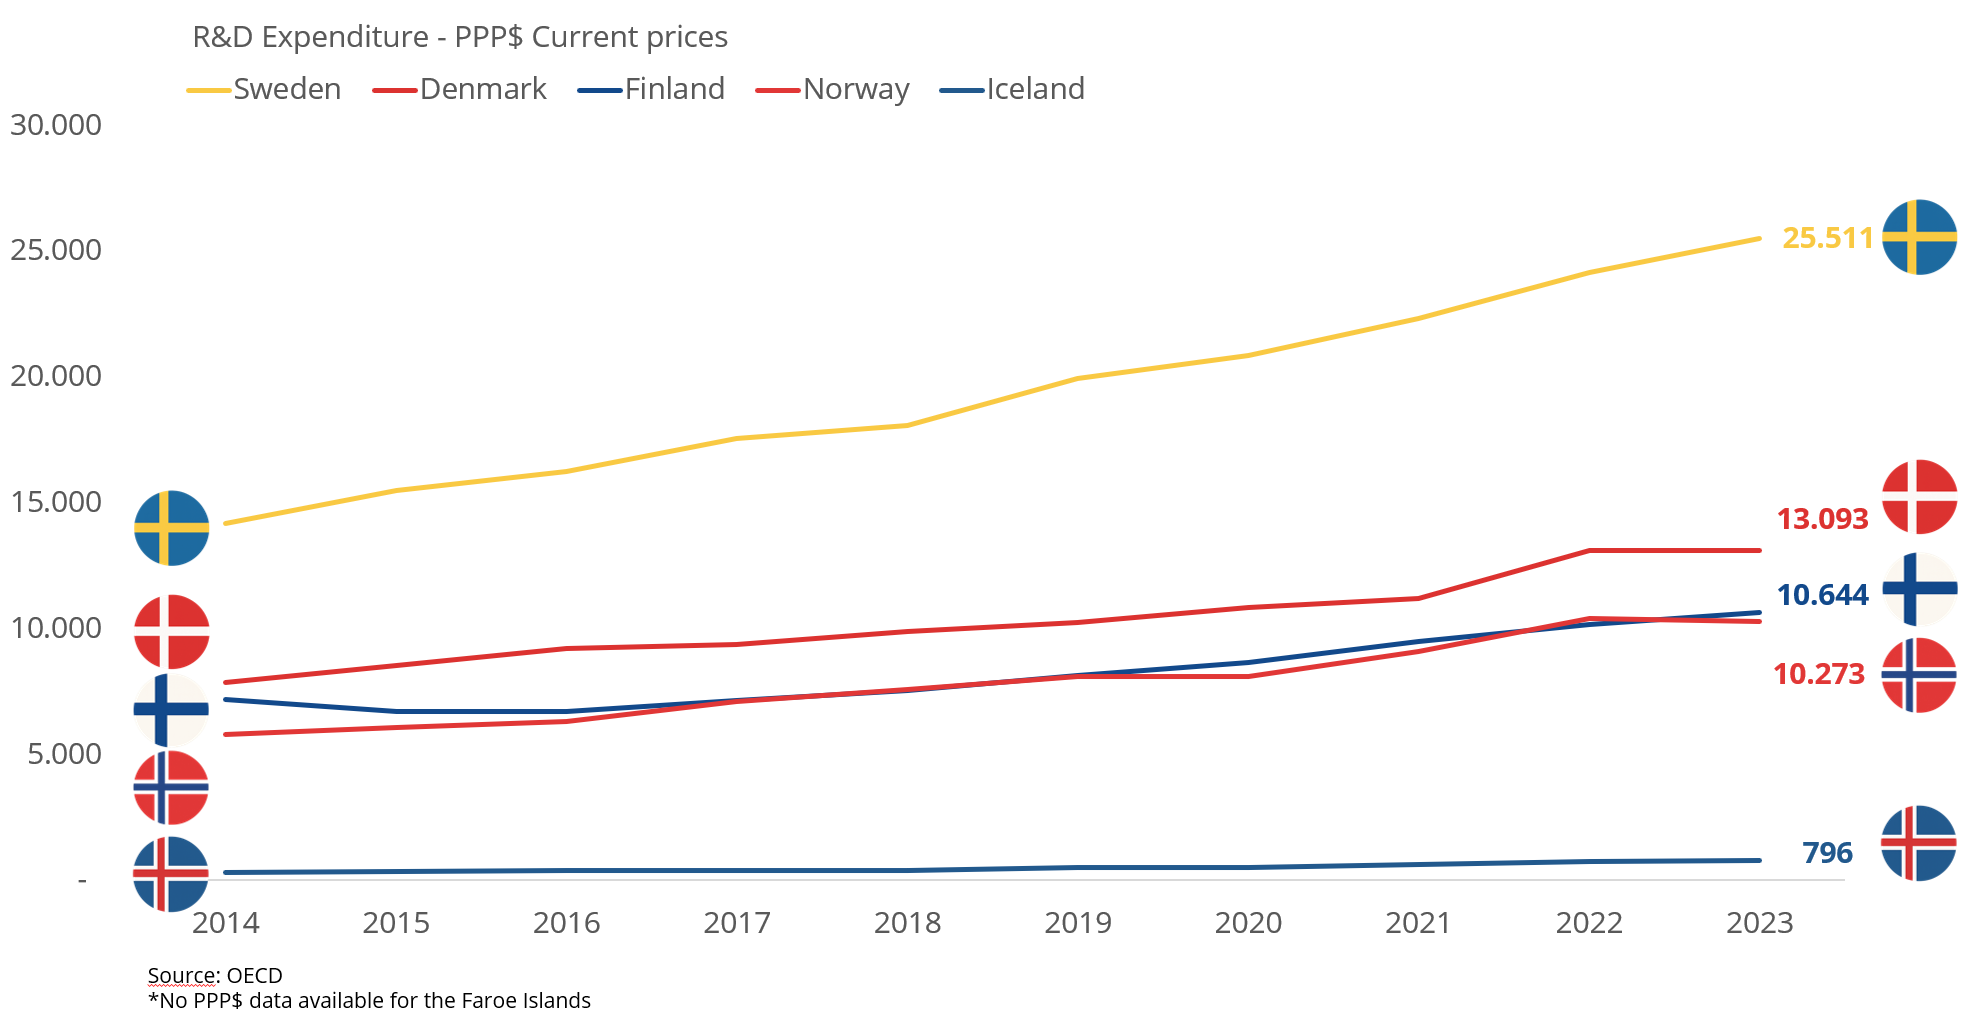
Sweden’s investments in R&D outpace other Nordic countries
While all Nordic countries have seen steady growth in the last few years, Sweden’s investments in R&D continue to grow at a faster rate than the rest, reinforcing its position as a frontrunner.
Figure 4 Trendlines – R&D expenditure measured in PPP$. Current prices. 2014–2023.
Combined R&D investments in the Nordics grew 6.4 percent over five years
Figure 5 Compound annual growth rates (CAGR) in GDP and R&D among Nordic countries. 2018–2023.
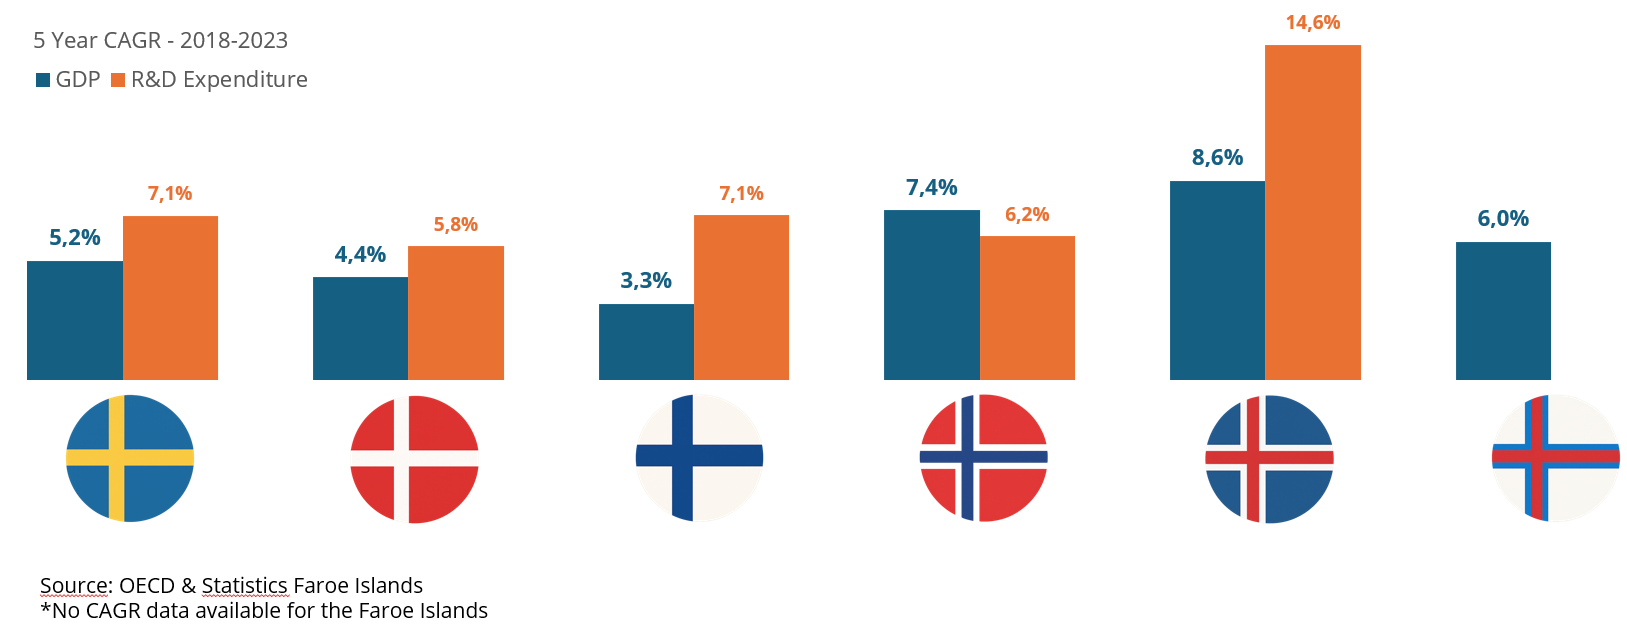
Source: OECD and Statistics Faroe Islands
Looking at the investments in R&D in the 5 year span from 2018 to 2023, all Nordic countries recorded a compound annual growth rate (CAGR) of more than +5 percent, with investments in Sweden, Denmark, Finland and Iceland outpacing GDP growth.
A compound annual growth rate (CAGR) is a way of measuring how much something grows, on average, per year, assuming the growth is compounded (reinvested) over time. The word “compound” refers to the process of growth building on previous growth. (Editor’s note)
Norway was the only country where the GDP has a higher CAGR than the national investments in R&D.
The year over year growth rates in R&D investments from 2022-2023 were lower than the 5 year CAGR across all Nordic countries, indicating a slower investment rate in R&D.
Figure 6 R&D expenditure growth rates among Nordic countries. 2022–2023.
Driving Sectors
The business enterprise sector is the primary R&D performer in the Nordic countries, representing 69.6 percent of the total investments in R&D in 2023. Higher education accounts for 19.7 percent and the government sector for 11.6 percent. Private non-profit organisations account for 0.1 percent.
Figur 7 R&D expenditure in the Nordic countries by R&D performing sector. 2023.
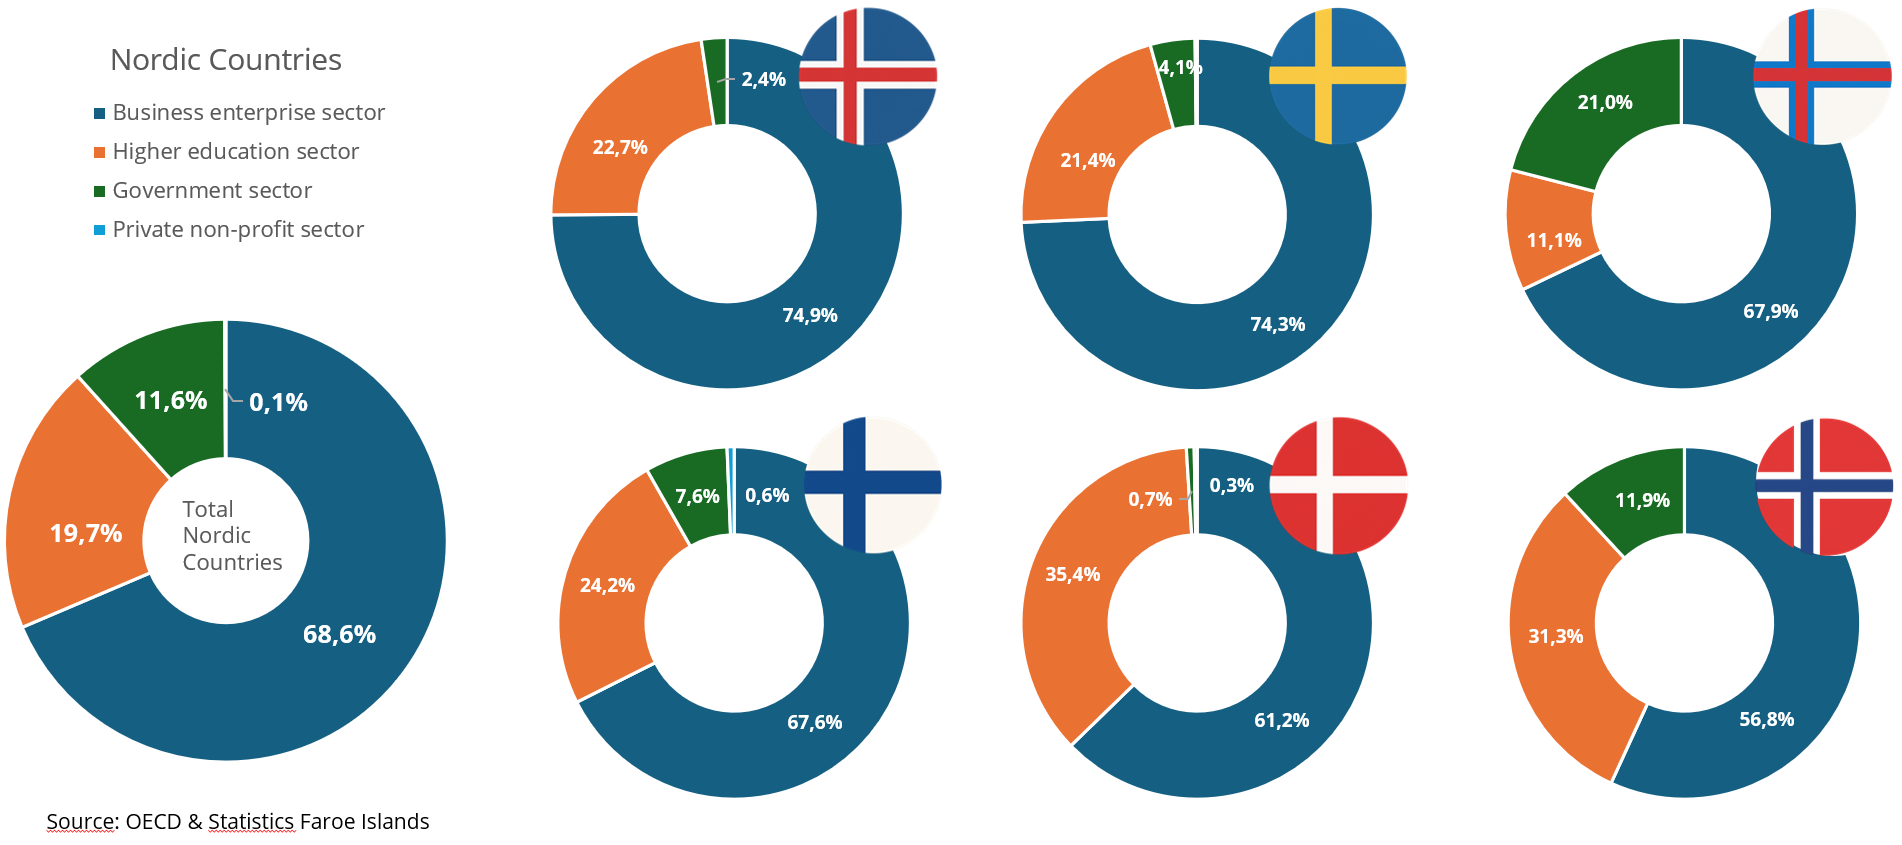
Iceland and Sweden had the highest concentration of R&D performance in the business enterprise sectoramong the Nordic countries. Over 74 percent of R&D was performed here in 2023. 26 percent was performed in government or higher education sectors.
The government and higher education sectors in Norway are responsible for 43 percent of the R&D in Norway, having the highest R&D performance concentration in the public sectors combined in the Nordic countries.
Denmark had the highest share of R&D performed in the higher education sector, representing 35 percent of the total national R&D activity. In Denmark, the size of the sector is influenced by merging of sectorial research institutes with universities back in 2007.
Overall, the business enterprise sector is responsible for about two-thirds of the R&D performance across nearly all countries, aligning with goal established in Barcelona by the EU commission in 2002. Norway is an exception, with less than 57 percent of R&D conducted in the business enterprise sector.
Foto: Government offices, Torshavn. Photo: Nicolas Vera-Ortiz
The post Sweden leads in R&D investments for the ninth consecutive year appeared first on Forskningspolitikk.
Dødsfall og overgrep – slår alarm om svikt i svenske hjemmetjenester
Svikt i hjemmetjenestene i Sverige skal ha ført til minst tolv dødsfall, melder SVT.
Svensk AI-startup henter 18 millioner etter hackathon-seier
AI-agent-gründere fikk investering fra Lovable.